Um projeto autoral pessoal
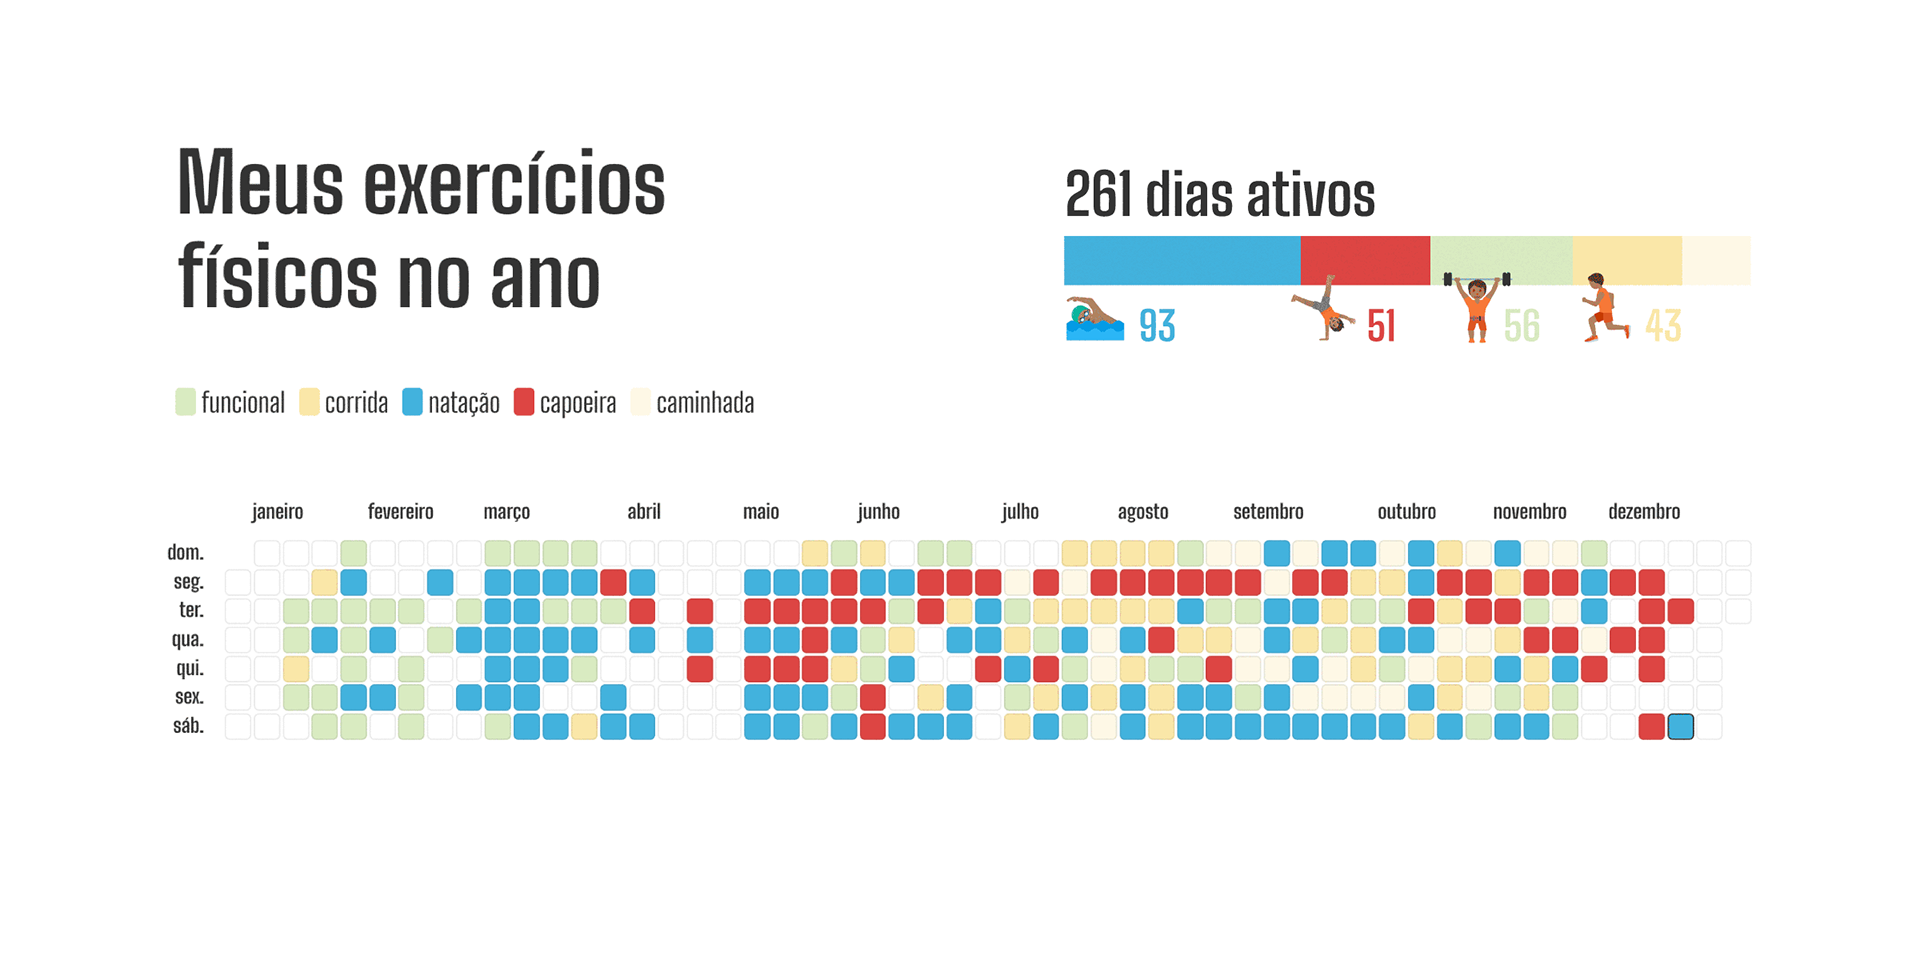
Registrei todas as minhas atividades físicas em 2024. Depois, criei uma série de gráficos com base nesses dados. Só por diversão. Espero que você curta a visualização de dados também. :)
Registrei todas as minhas atividades físicas em 2024. Depois, criei uma série de gráficos com base nesses dados. Só por diversão. Espero que você curta a visualização de dados também. :)
A personal authorship project
I tracked all my physical activities in 2024. Then I created a series of charts based on this data. Just for fun. I hope you enjoy the dataviz too. Only in Portuguese :)
I tracked all my physical activities in 2024. Then I created a series of charts based on this data. Just for fun. I hope you enjoy the dataviz too. Only in Portuguese :)
Algumas palavras sobre o processo
Comecei atualizando uma planilha com base nos registros que fiz no aplicativo. Depois, iniciei algumas visualizações de dados no Flourish. Mais tarde, percebi que seria divertido criar uma animação com esses dados. Observando o template do Flourish, entendi como precisava configurar a planilha e usei o Claude.ai para agilizar o processo. Adicionei alguns comentários e estava pronto.
Enquanto fazia alguns testes nas visualizações, me diverti aprimorando o projeto. Natação e capoeira foram destacadas com cores mais fortes. Me permiti brincar com as fontes disponíveis. Não resisti à piadinha de usar a tipografia "Big Shoulders" no projeto — agora fico me perguntando, com bom humor, se foi uma boa decisão. Mas a ideia do projeto é justamente brincar com as minhas habilidades. Foi uma diversão.
Some words about the process
I started by updating a spreadsheet that reflected my records in the app. Then, I began with some data visualizations in Flourish. Later, I realized it would be fun to make an animation with this data. By observing Flourish's template, I understood how I needed to configure the spreadsheet and I used Claude.ai to speed up the process. I added some comments and it was done.
I started by updating a spreadsheet that reflected my records in the app. Then, I began with some data visualizations in Flourish. Later, I realized it would be fun to make an animation with this data. By observing Flourish's template, I understood how I needed to configure the spreadsheet and I used Claude.ai to speed up the process. I added some comments and it was done.
While making some tests in the visualizations, I had fun improving the project. Swimming and capoeira I highlighted with stronger colors. I allowed myself to play with the available fonts. I couldn't resist the little joke of using 'Big Shoulders' as the project's typography - now I wonder with good humor if it was a good decision. But the idea of this project is playing with my abilities, it was a piece of fun.