

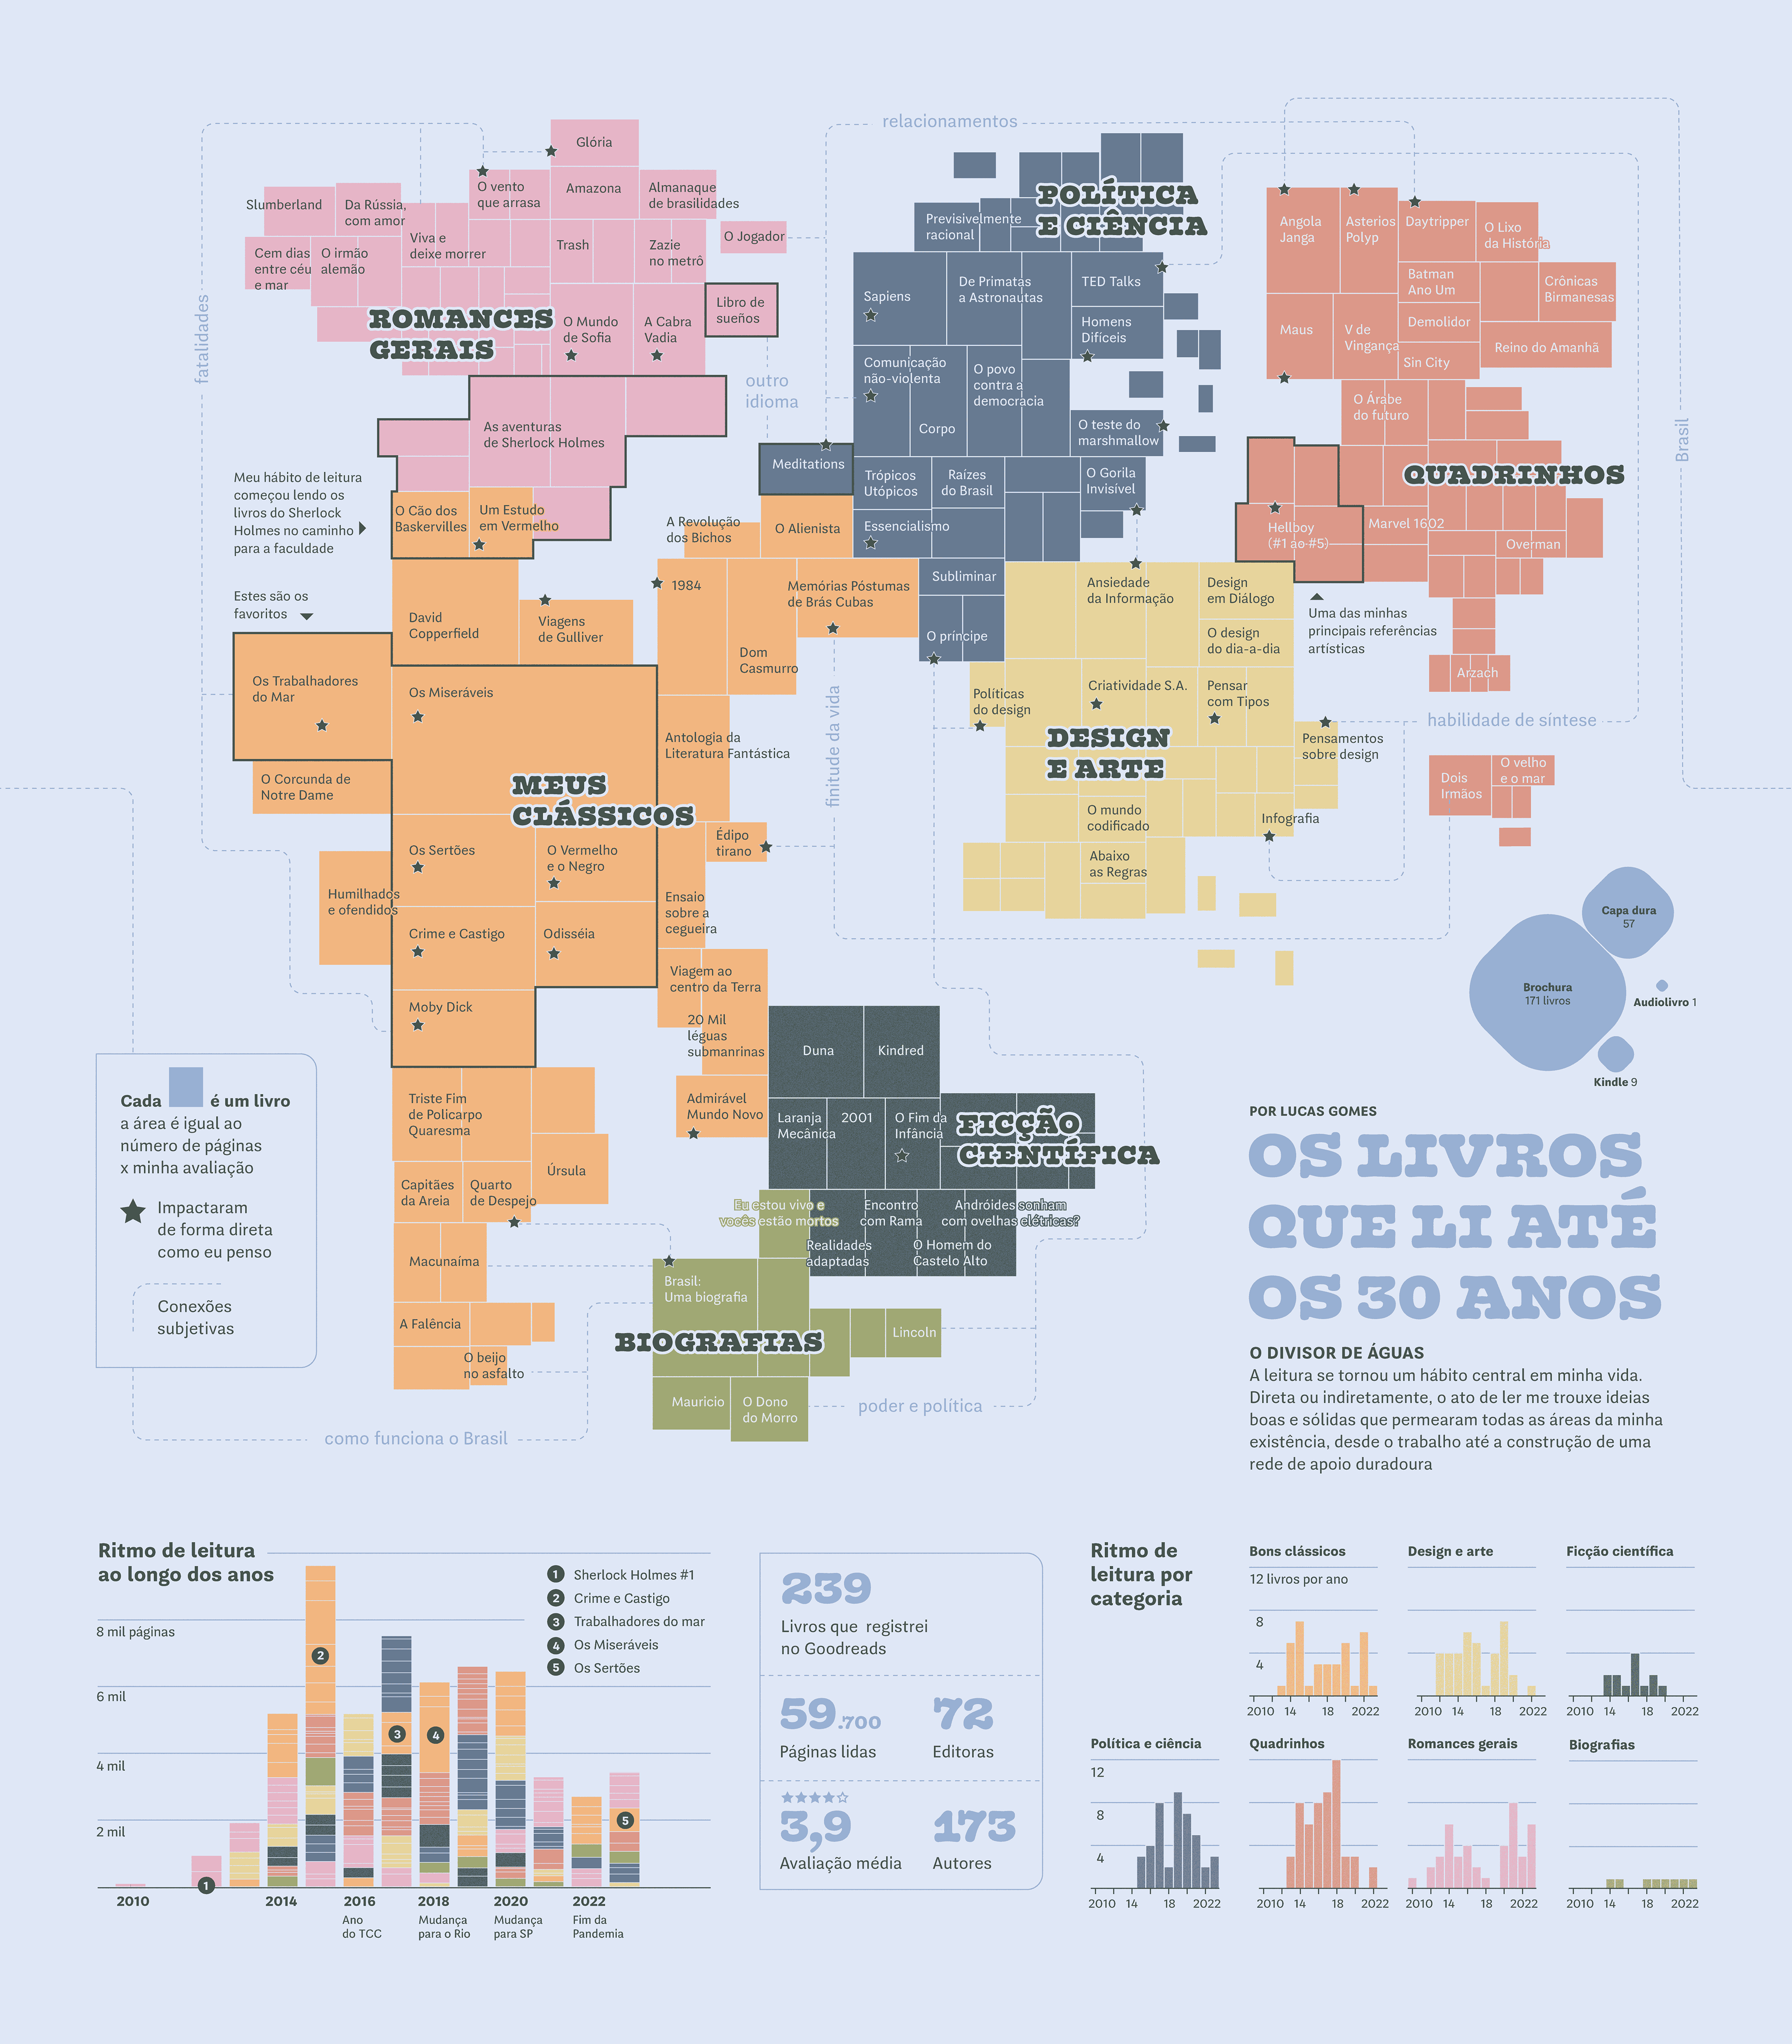
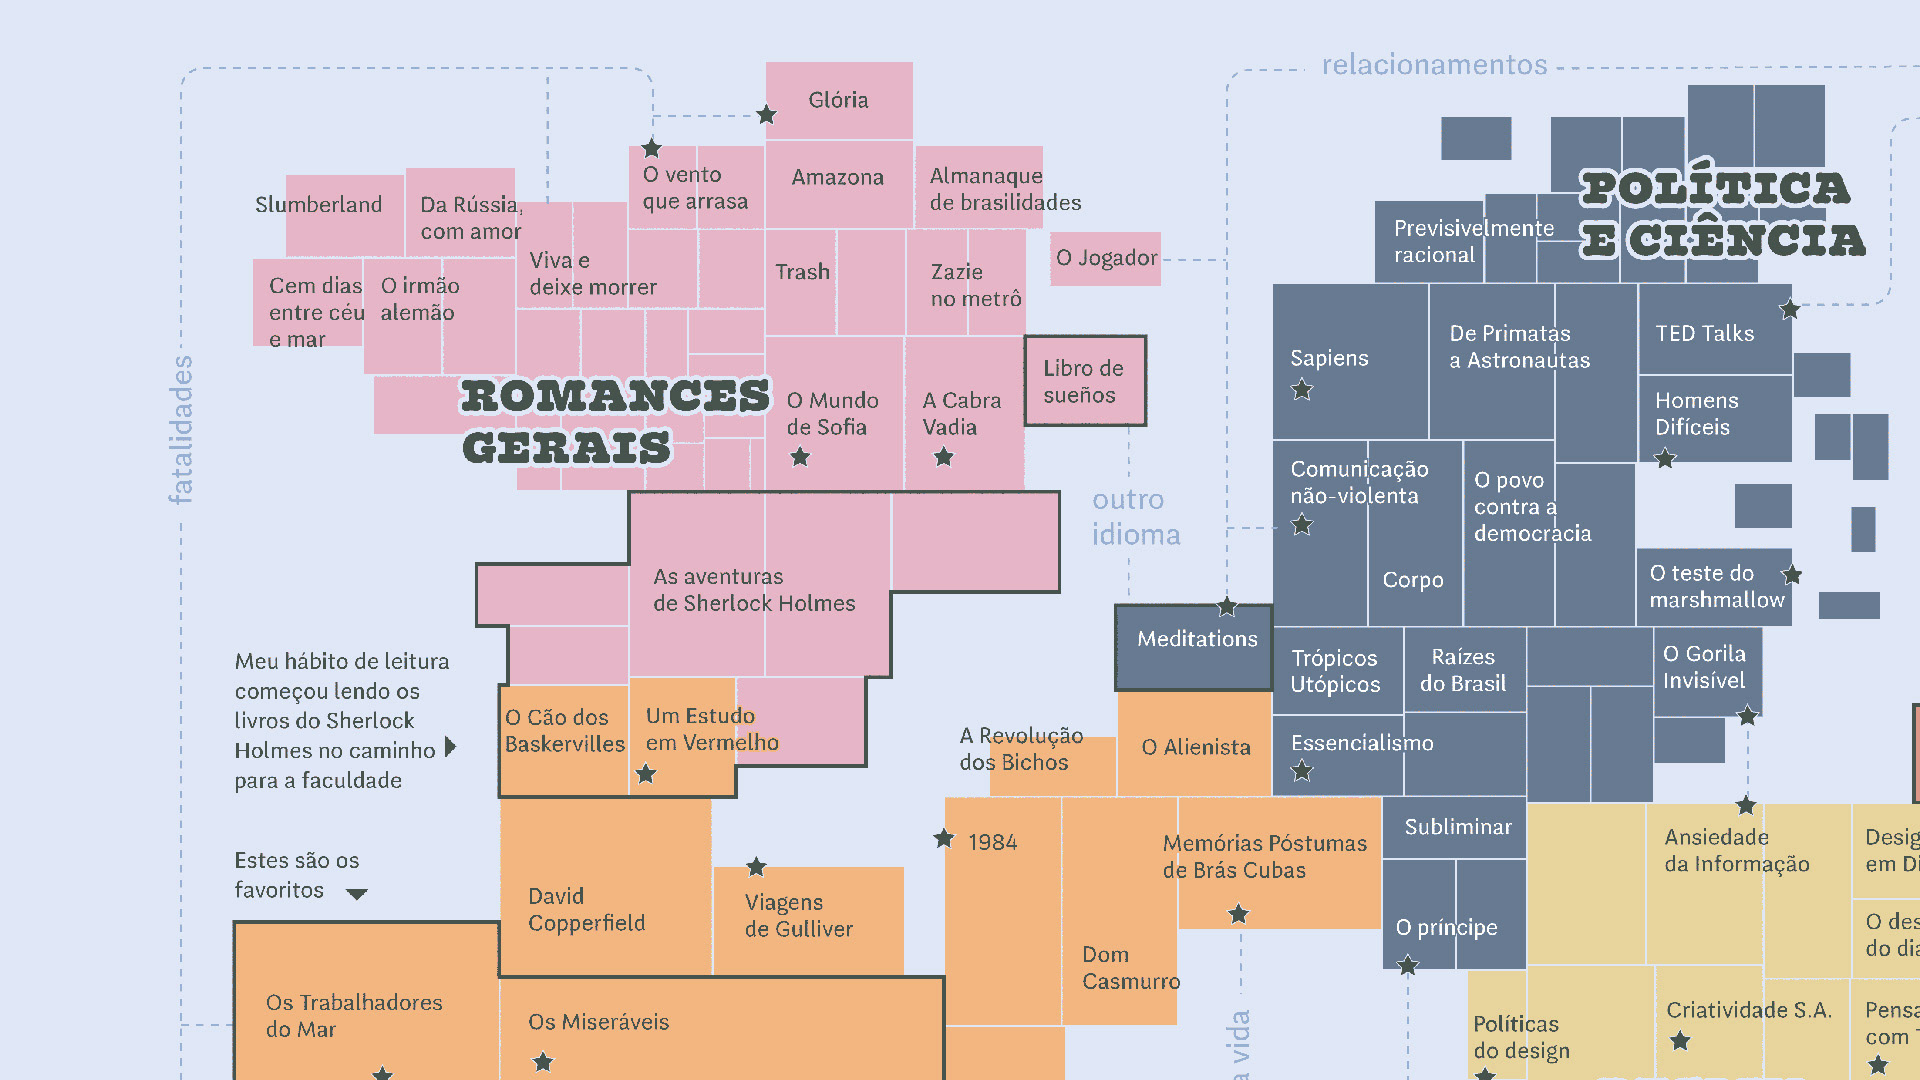
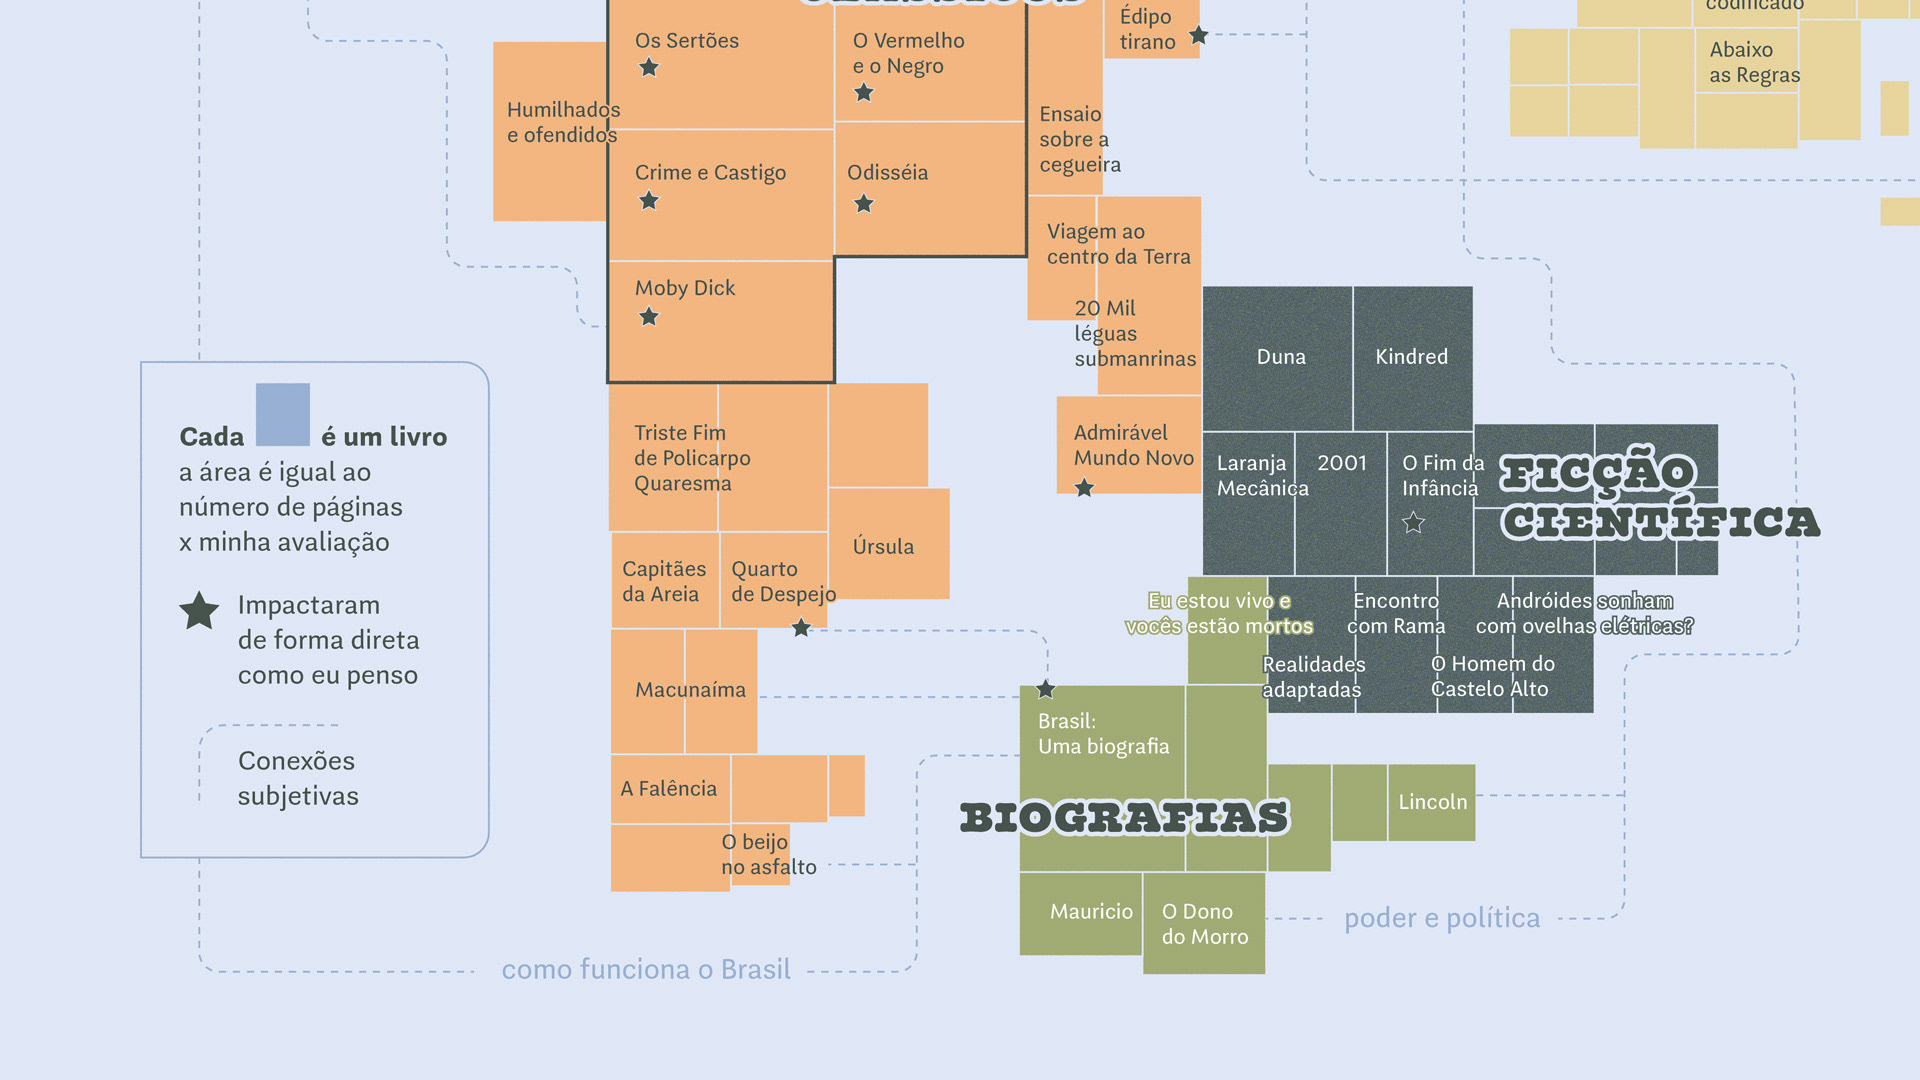
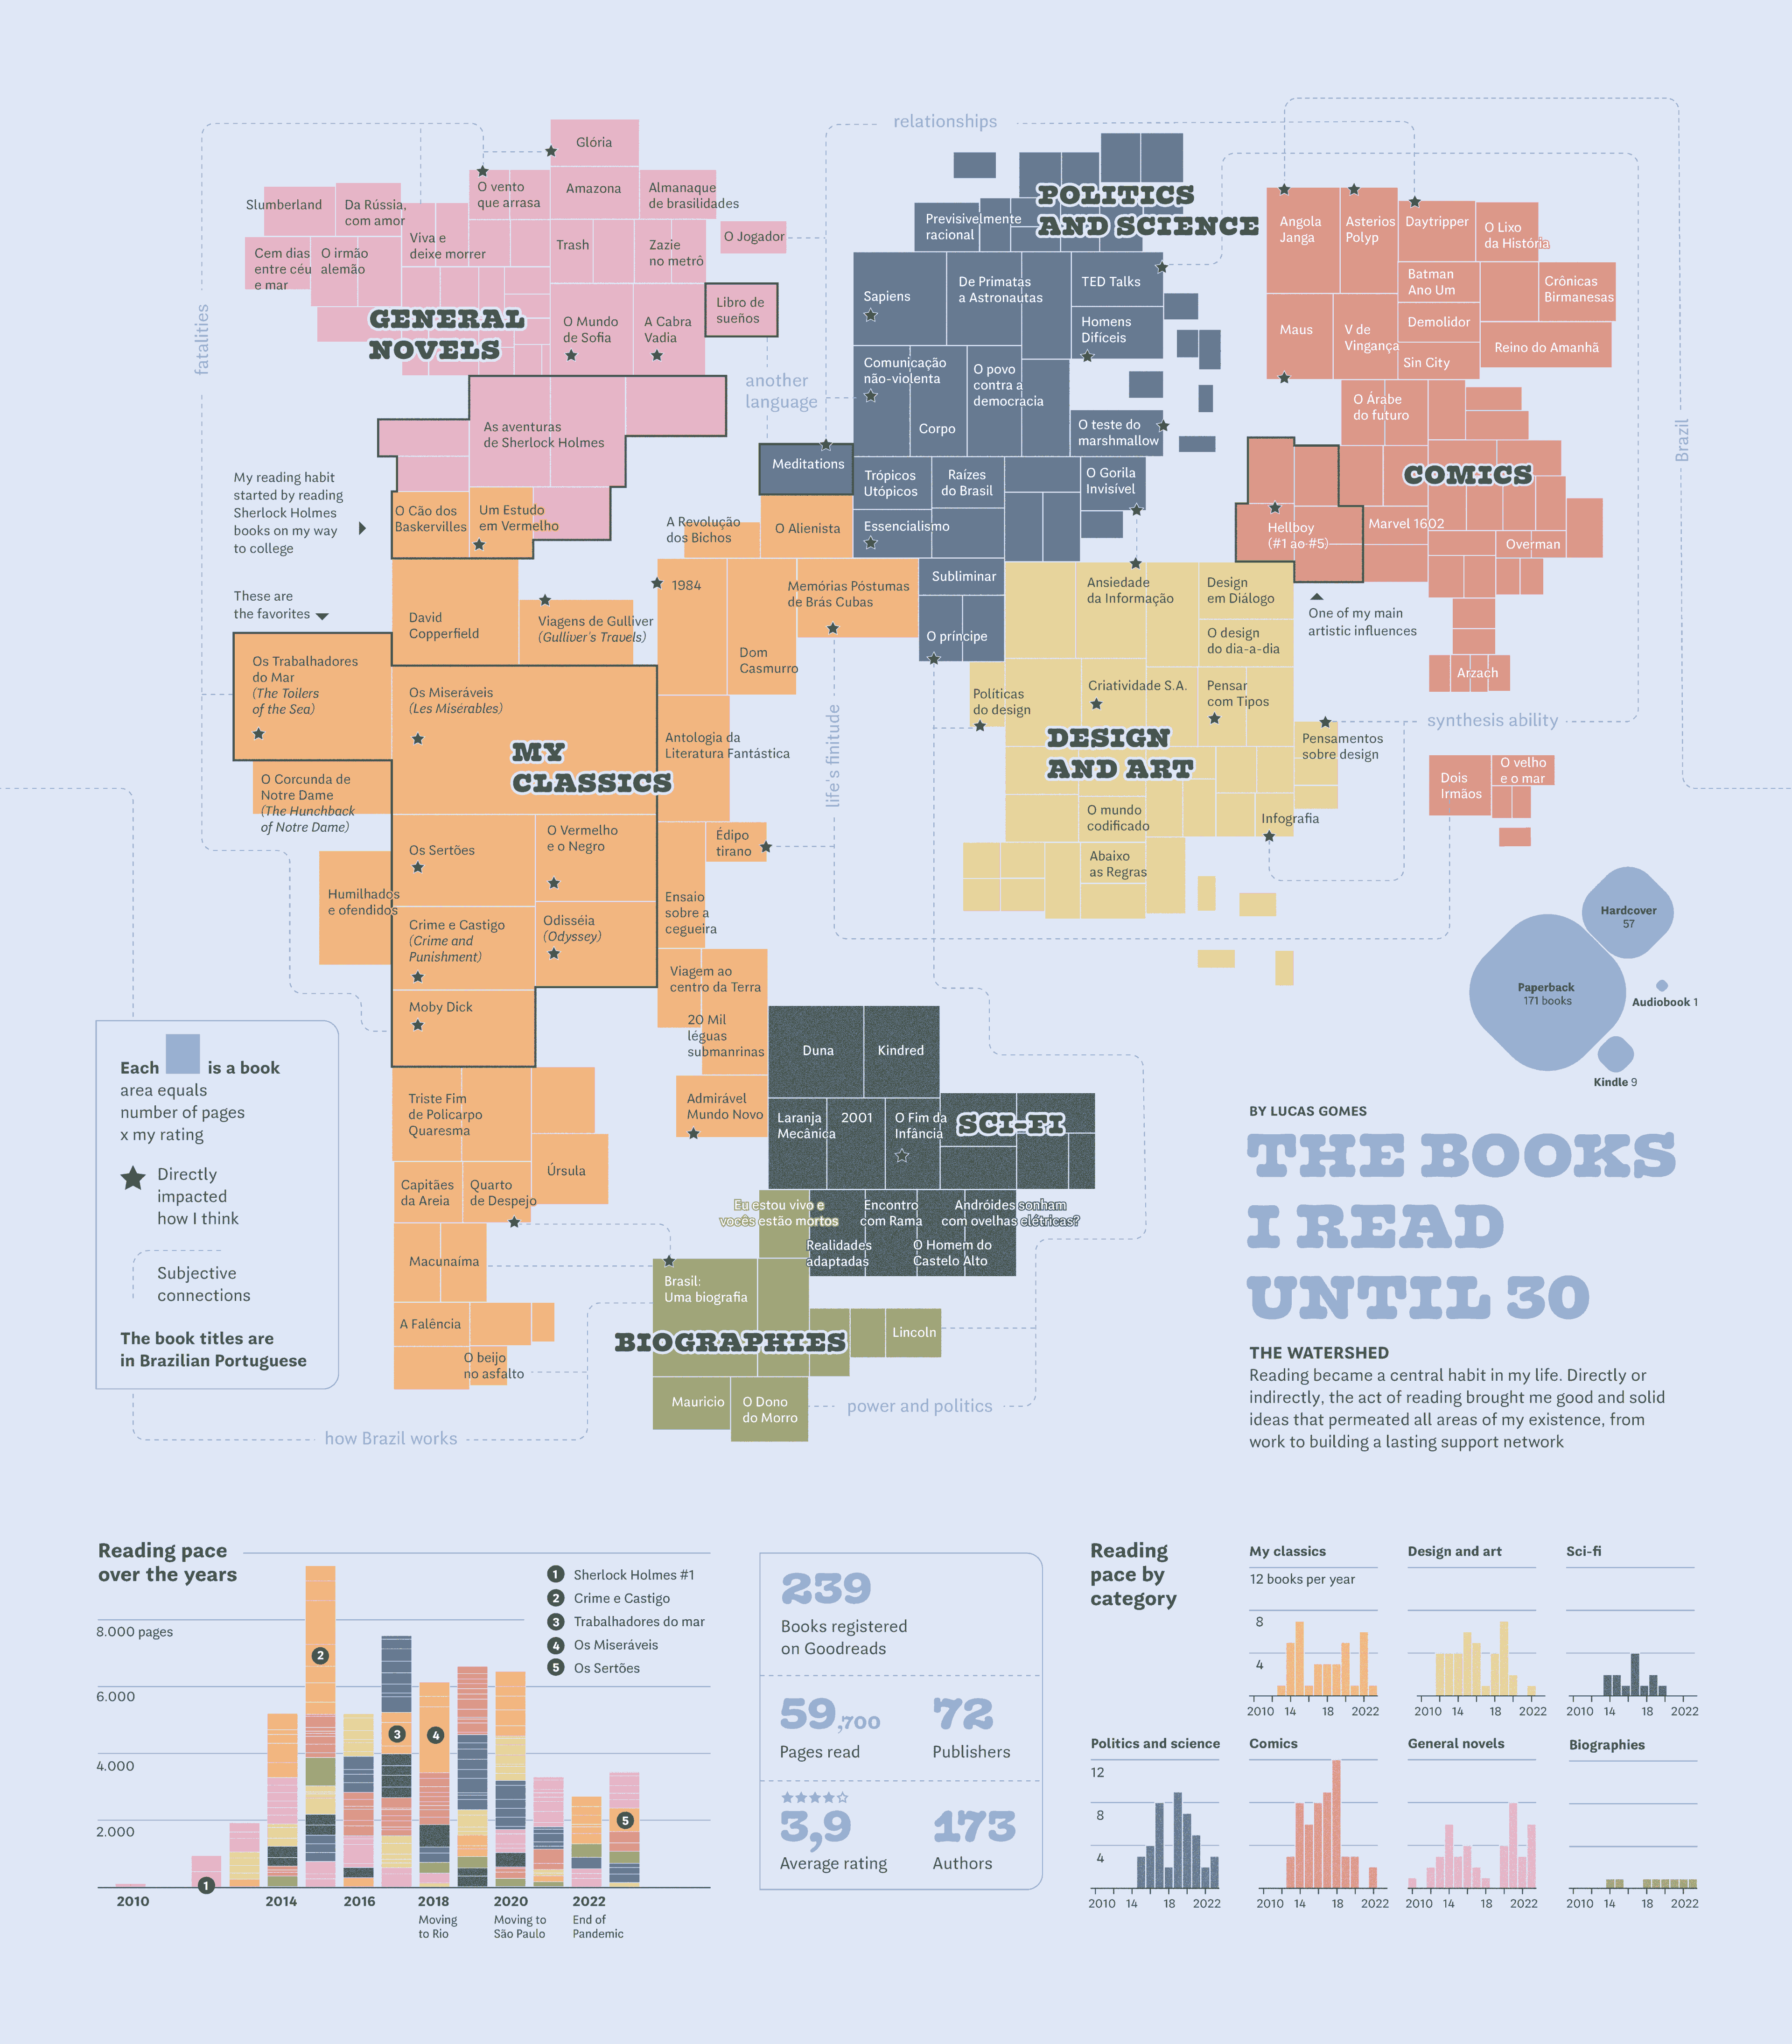
A data visualization that transforms about 60,000 pages into cartography. The project is an intimate visual exploration that turns reading memories into territory. Each book is a country in this personal atlas. Stars mark the most influential readings.
The connections between territories reveal how readings complement each other and form a network of references. Goodreads data was enriched with personal meanings, transforming the reading habit into a landscape where numbers and emotions coexist.
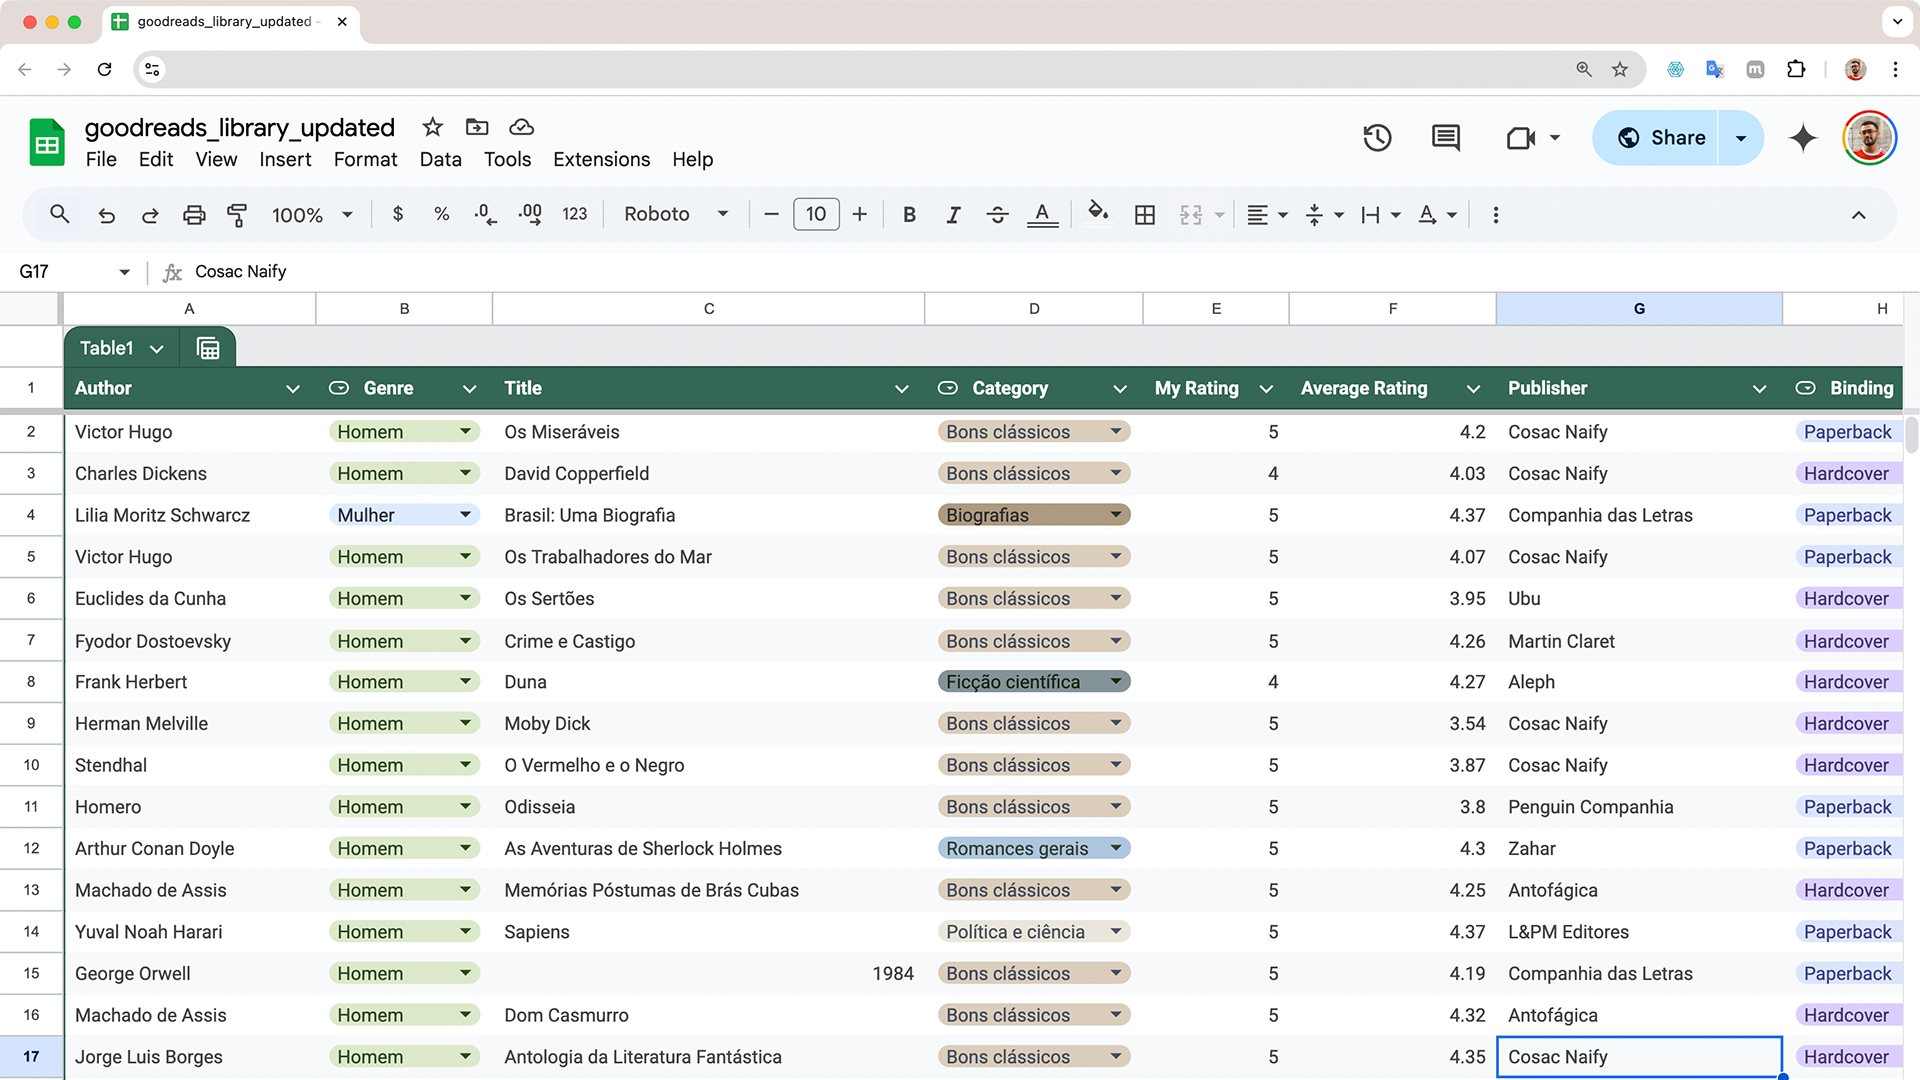
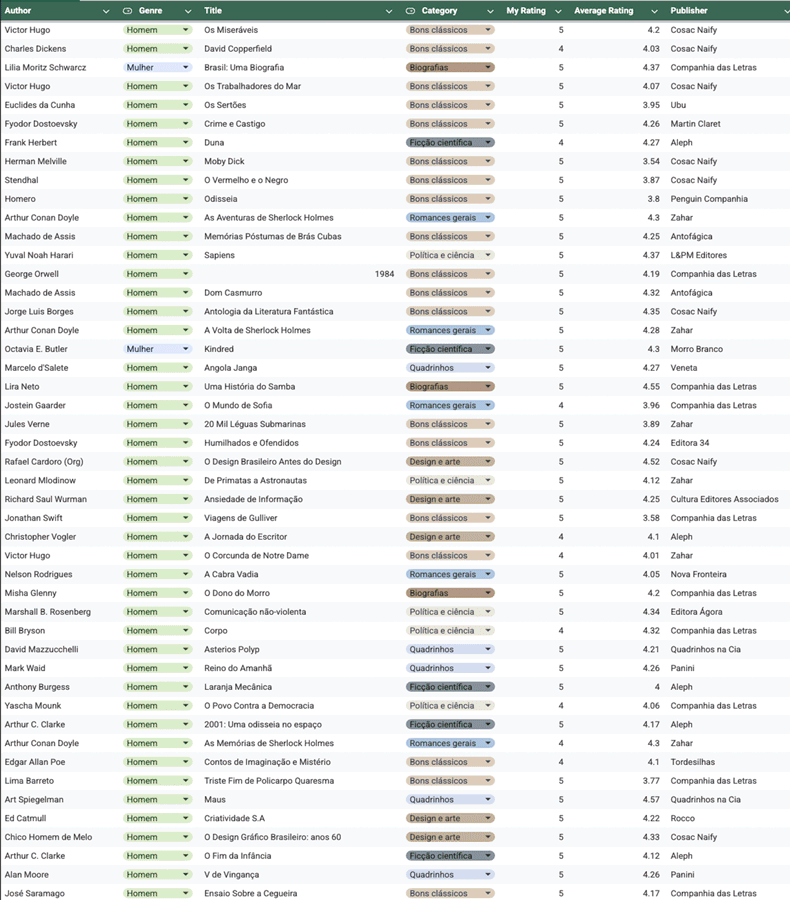
The process began with a Goodreads exported spreadsheet, where I record all books I've read. During the process, I realized the need to enrich the data: like authors' gender and relevant categories for me. The data became more human and detailed, revealing previously unseen patterns.
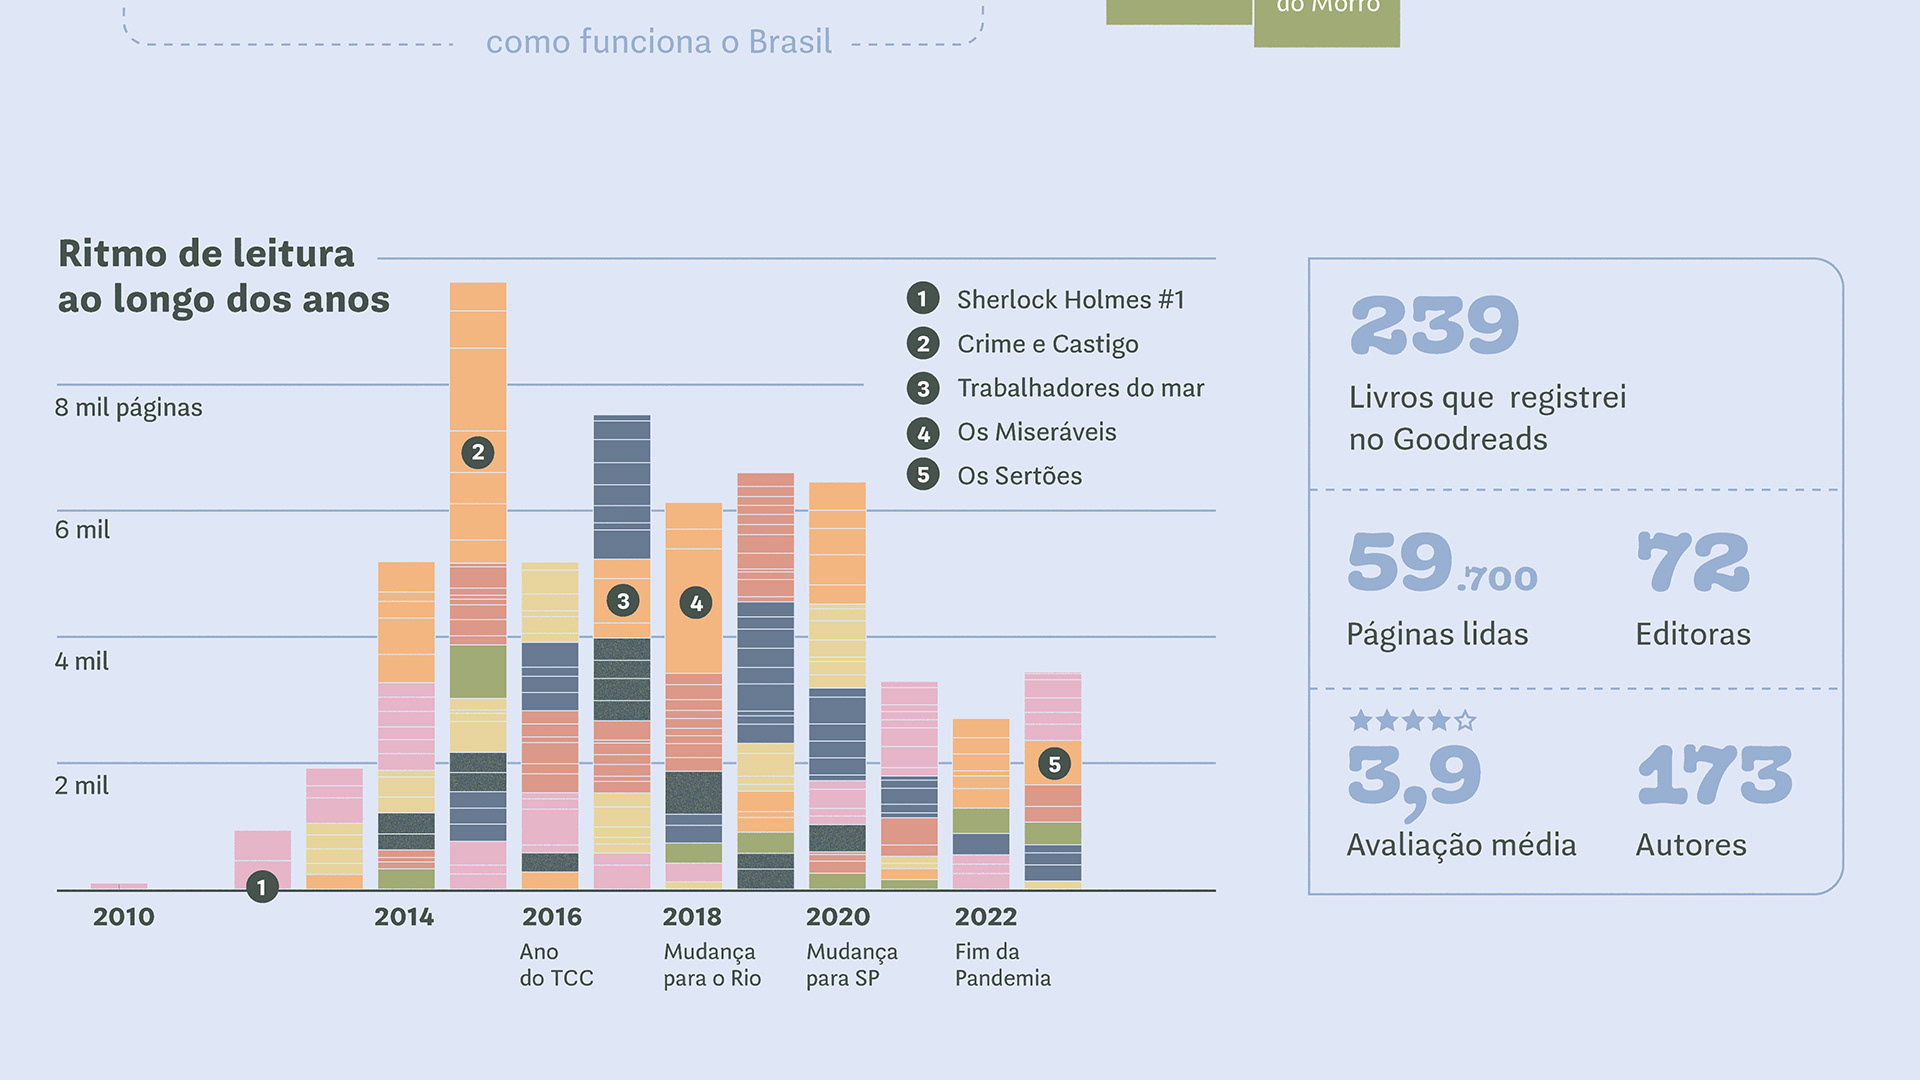
Beyond the cartography, I explored different forms of data visualization. I created charts to analyze my reading evolution over the years and identified the distribution of ratings. Through various tests, I found the best way to tell this story. This process revealed that data analysis is also a way to discover new perspectives about one's literary journey.
Behind of the creative process: mistakes, successes and editing choices
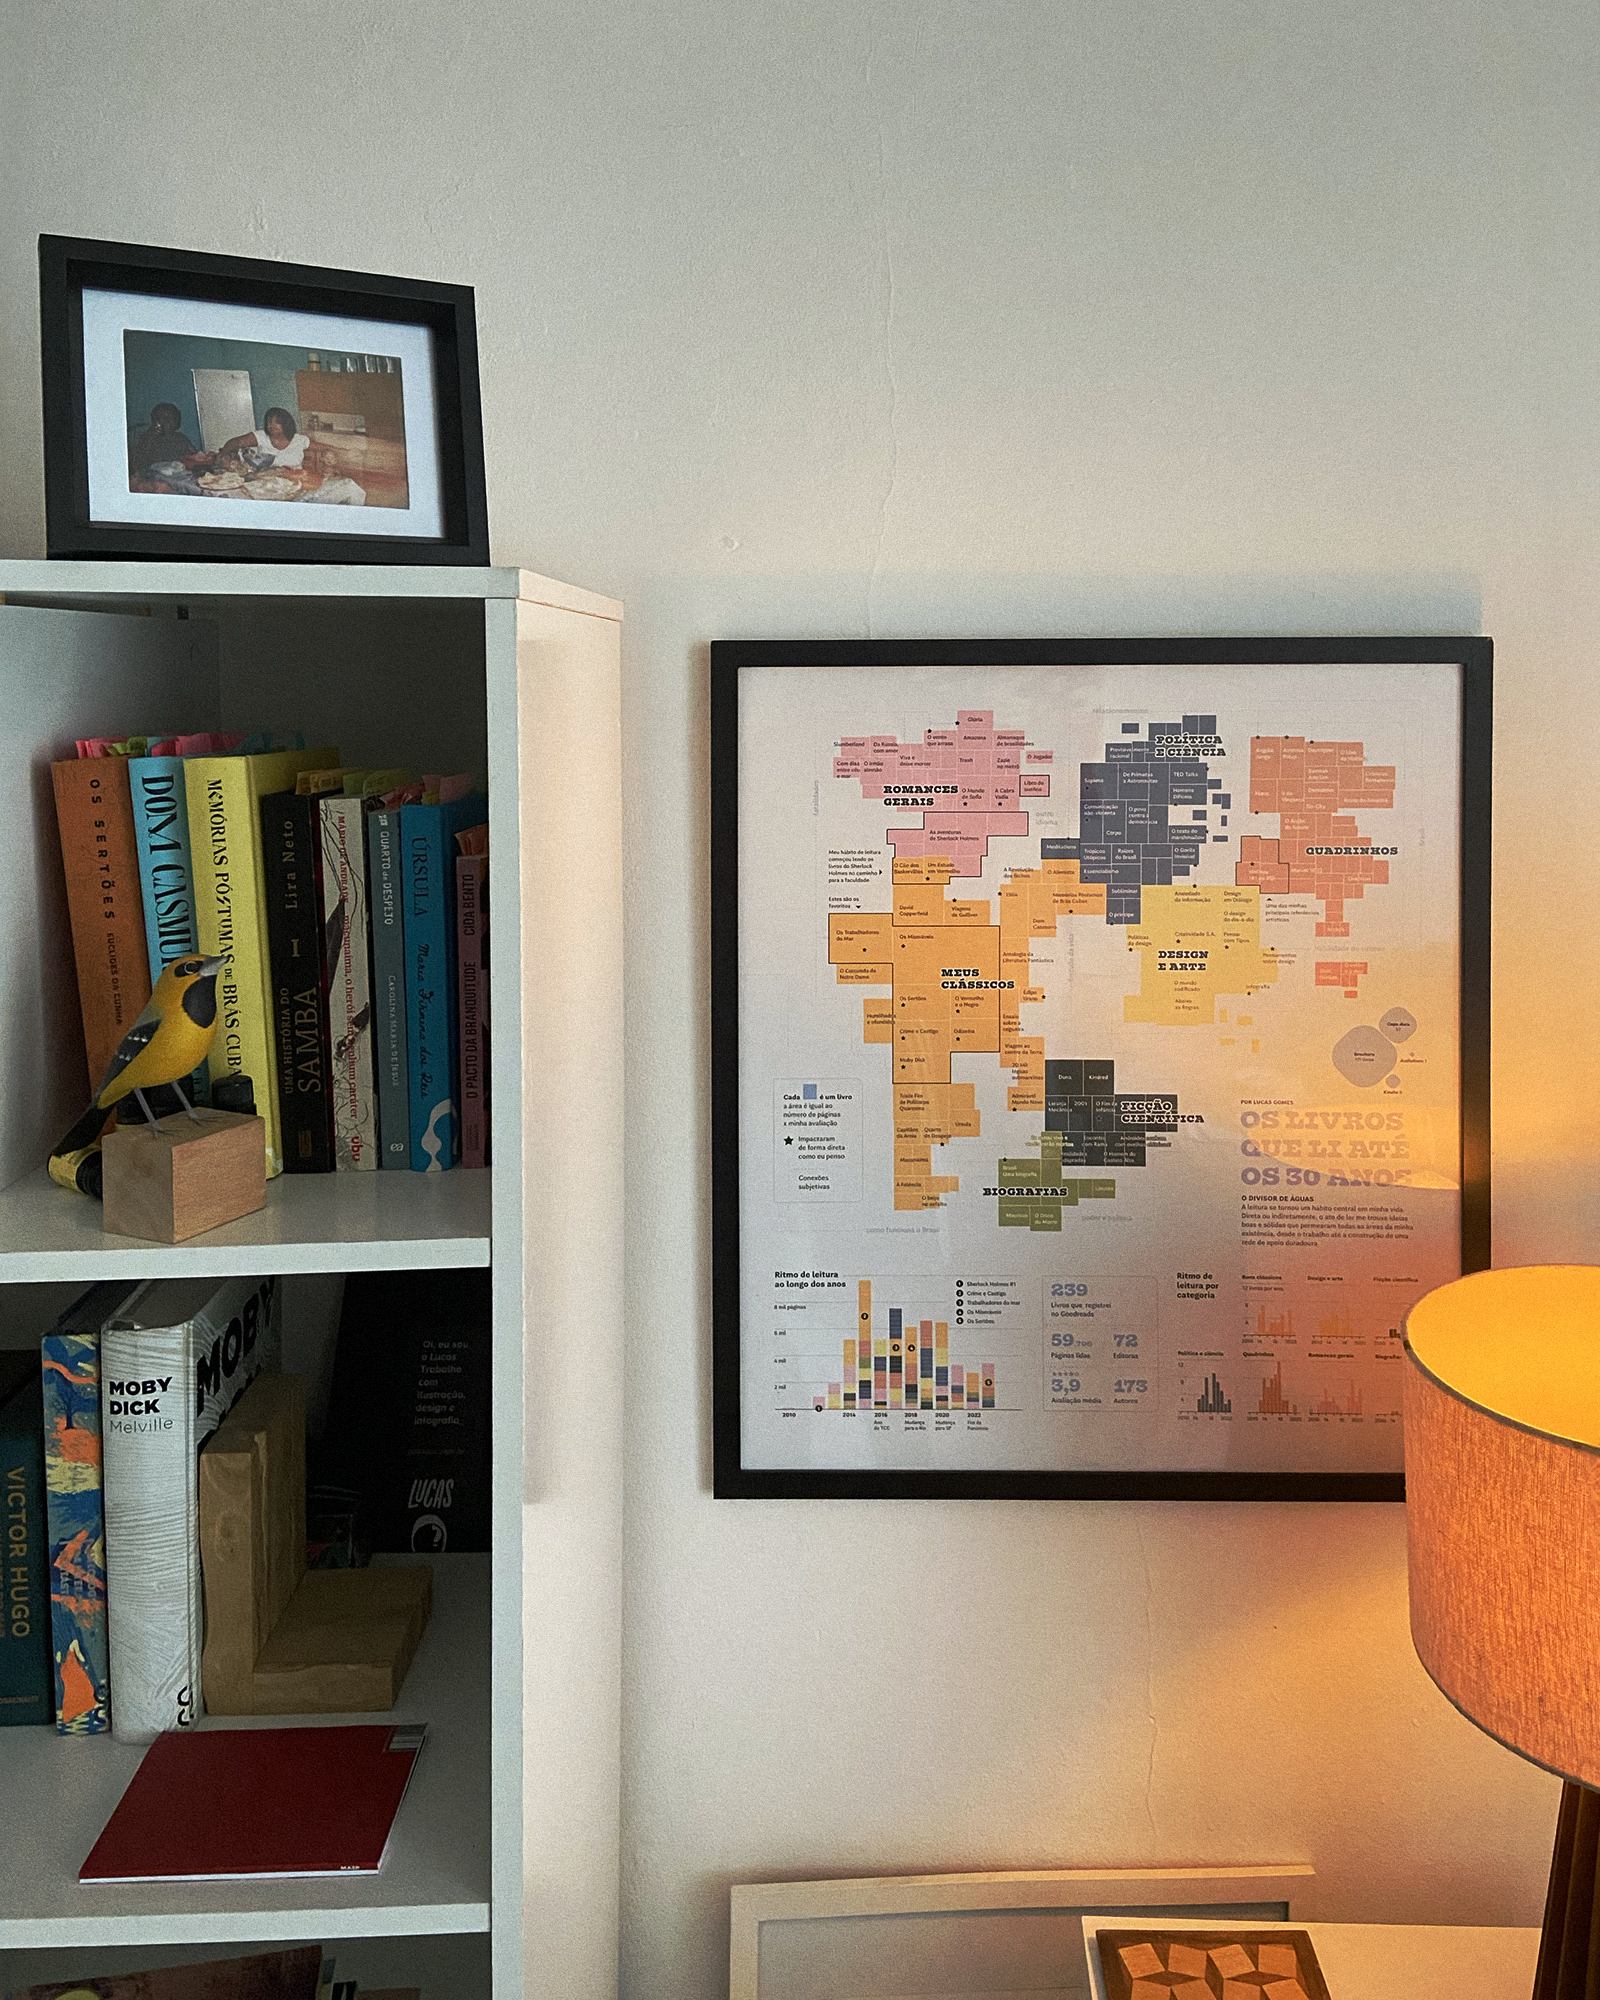
This visualization transcends a simple book map. It's a portrait of how reading became a central habit in my life, both professionally and in relationships. This work, which interprets raw data into a visual narrative, invites other readers to reflect on their own literary journeys. It's a tribute to the reading habit and its power to transform lives.
Details:
Date: February 2024
Dimensions: 57 x 65 cm
Paper: Hahnemuhle Matt Fibre
Database: Goodreads
Data editor: Google Spreadsheets and ChatGPT 4.0
Graphics: Flourish Studio and ChatGPT 4.0
Design: Adobe Illustrator
Date: February 2024
Dimensions: 57 x 65 cm
Paper: Hahnemuhle Matt Fibre
Database: Goodreads
Data editor: Google Spreadsheets and ChatGPT 4.0
Graphics: Flourish Studio and ChatGPT 4.0
Design: Adobe Illustrator
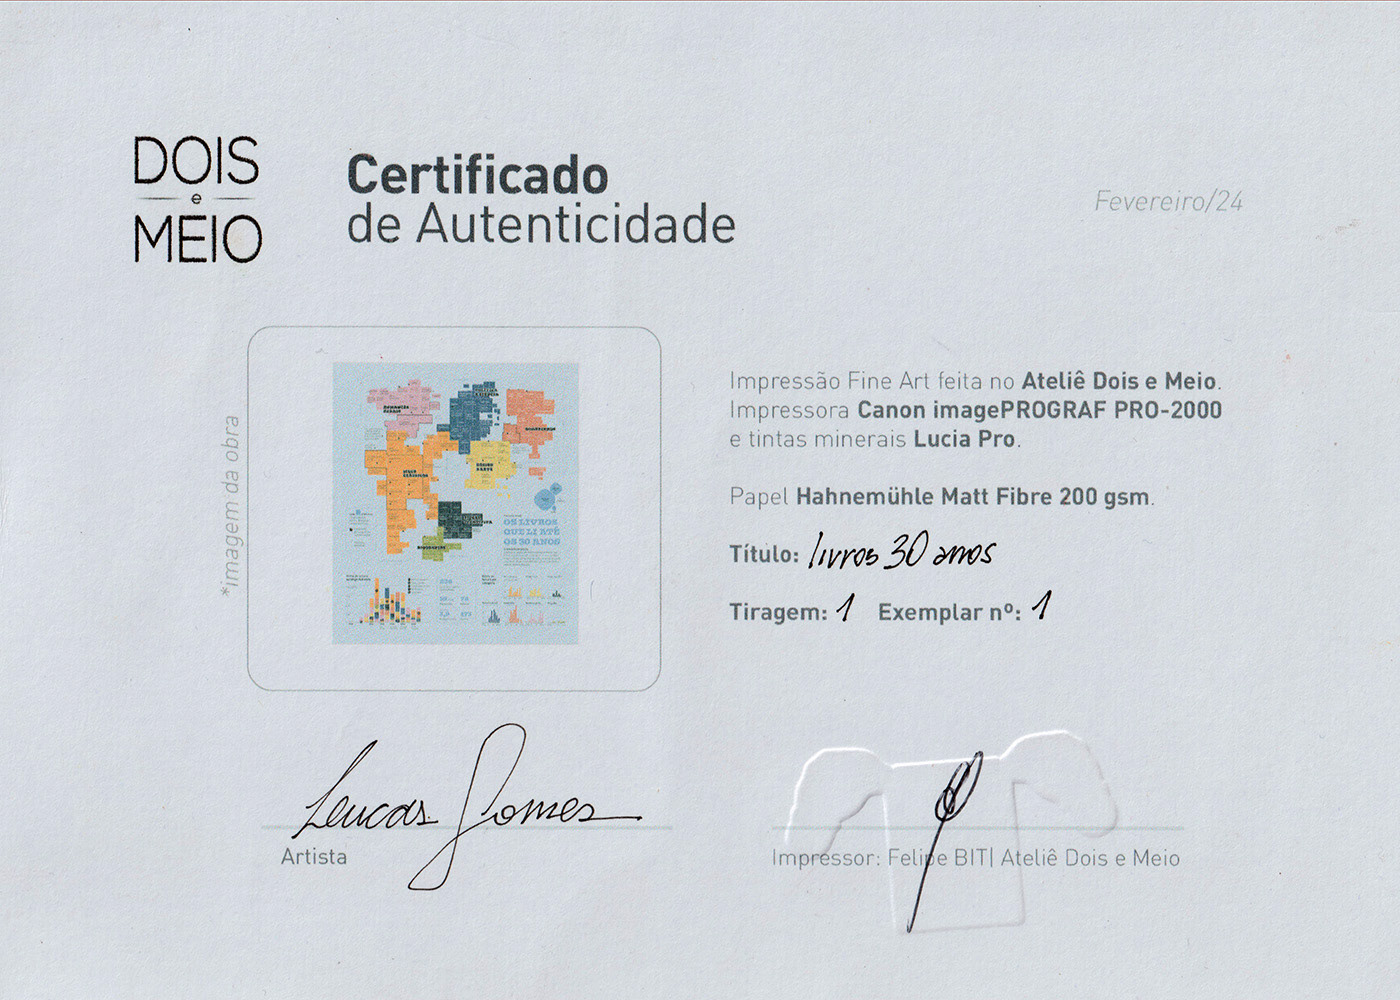
Certificate of authenticity issued by Dois e Meio Studio in February 2024 for a single-edition Fine Art print titled "livros 30 anos", printed on Hahnemühle Matt Fibre paper using a Canon PRO-2000 printer with Lucia Pro inks,